Measure and monitor your inlets tunnels

Alex Ellis
In this new release of inlets, you can now get insights into your tunnel servers through the status command and new Prometheus monitoring. I’ll walk you through why inlets was built as a Cloud Native tunnel, followed by the various changes and features introduced in this release.
The inlets 0.9.0 releases adds:
- A new
statusCLI command to monitor tunnels - Load-balancing of requests between clients using TCP tunnels
- An ARM64 Darwin binary for Apple M1 users
- Prometheus metrics for TCP and HTTP tunnels
You’ll also notice that a few commands and flags have changed, I’ve taken care to note each of these for you.
What is Cloud Native anyway?
In 2017 Alexis Richardson, CEO of Weaveworks and former chair to the ToC of the CNCF gave a presentation, where he mentioned the following as being important drivers of Cloud Native applications:
- Automation, lots of it. End to End - CI, observability, Orchestration
- Focus on the app, not the infrastructure, i.e. containers because they just work
- Understand and apply new patterns for monitoring, logging, uptime management - microservices and beyond
Alexis’ vision from 2017 aligns closely with what we’ve seen evolving with CNCF projects and the ecosystem surrounding it.
I’ve seen a growing set of projects and products that interop well. Why is that important? Rather than needing one single monolithic application that covers every use-case and responsibility, building blocks can be composed together to achieve the same goal, with more speed and less effort overall.
Cloud Native from my own journey:
From the version first versions of OpenFaaS, a serverless platform for Kubernetes users, I knew that using other Cloud Native projects would be key to adoption and sustainability. I didn’t try to build a monitoring system, an auto-scaler, or a message queue.
I simply picked the best projects from the CNCF landscape that aligned with the values of OpenFaaS. NATS was chosen for asynchronous messages and was lightweight with good defaults, Prometheus managed metrics and auto-scaling alerts and Kubernetes and Docker provided for multi-node orchestration.
Inlets is a Cloud Native for all of the reasons described above. It will run well as a binary on an Intel or ARM server, on Windows, Linux and MacOS. It can also be run as a container or as a Kubernetes Pod, and is easy to automate through common tools.
Who needs a Cloud Native Tunnel?
You can run it as a developer in the same way you would do a SaaS tunnel, or as as home-lab enthusiast hosting Ingress to a private network, or as a SaaS vendor - federating on-premises customers into your system. It’s a quick and reliable way to make private services addressable on your own network or the Internet.
One inlets customer is a large business that sells an on-premises Git solution and a cloud-hosted project management solution. They were able to use inlets to integrate their on-premises Git product with their newer cloud-hosted project management tool. With more and more traditional on-premises companies like Dell looking to SaaS models, inlets is well-positioned to help traditional companies bridge that gap.
Now I’ll cover the new changes, and deprecations, followed by a walk-through and explanation of the new Prometheus metrics added in this release.
New changes and deprecations
The --token-env option has been added to the client and server commands so that inlets can be used more easily with PaaS platforms that store secrets as environment variables. Examples include ECS, Fargate, Heroku and Fly. In the same vein, --license-env has been added to the client commands so that ECS Anywhere users can update their license tokens on edge devices, if and when required.
The inlets-pro http fileserver command has moved up one level to inlets-pro fileserver so that it’s easier to discover and less to type in.
The flag --token-from is now deprecated and will be removed in a future release, see also: token-file which does the same thing with a more consistent name.
The --print-token flag has been removed from the inlets HTTP client and server, given that the token is an input it should already be possible to print this value yourself.
The new status command
There is a new inlets-pro status command that you can use with HTTP or TCP tunnels. It can help you understand how tunnels are being used, and later on you may choose to move to Prometheus metrics (explained below) for background monitoring and alerting.
You can find out tunnel statistics, uptime and connected clients without logging in with a console or SSH session.
Here’s an example of a TCP tunnel server:
$ inlets-pro status \
  --url wss://178.62.70.130:8123 \
  --token "$TOKEN" \
  --auto-tls

Querying server status. Version DEV - unknown
Hostname: unruffled-banzai4
Started: 49 minutes
Mode: tcp
Version:        0.8.9-rc1

Client ID                        Remote Address     Connected Upstreams
730aa1bb96474cbc9f7e76c135e81da8 81.99.136.188:58102 15 minutes localhost:8001, localhost:8000, localhost:2222
22fbfe123c884e8284ee0da3680c1311 81.99.136.188:64018 6 minutes  localhost:8001, localhost:8000, localhost:2222
You can see two clients connected and which ports they make available on the server. All traffic to the data plane for ports 8001, 8000 and 2222 will be load-balanced between the two clients for HA.
And the response from a HTTP tunnel:
$ inlets-pro status \
  --url wss://147.62.70.101:8123
  --token "$TOKEN"
  --auto-tls

Server info:
Hostname: creative-pine6
Started: 1 day
Mode:           http
Version:        0.8.9-rc1
Connected clients:
Client ID                        Remote Address     Connected Upstreams
4e35edf5c6a646b79cc580984eac4ea9 192.168.0.19:34988 5 minutes example.com=http://localhost:8000, prometheus.example.com=http://localhost:9090
Here we have one client which provides two separate domains. You can connect multiple clients with different domains if you wish.
You can also access the status endpoint though curl using an Authorization header and the token you set up for the server:
$ curl -ksLS https://127.0.0.1:8123/status \
-H "Authorization: Bearer $TOKEN"
Example response from a HTTP tunnel:
{
  "info": {
    "version": "0.8.9-18-gf4fc15b",
    "sha": "f4fc15b9604efd0b0ca3cc604c19c200ae6a1d7b",
    "mode": "http",
    "startTime": "2021-08-13T12:23:17.321388+01:00",
    "hostname": "am1.local"
  },
  "clients": [
    {
      "clientID": "0c5f2a1ca0174ee3a177c3be7cd6d950",
      "remoteAddr": "[::1]:63671",
      "since": "2021-08-13T12:23:19.72286+01:00",
      "upstreams": [
        "*=http://127.0.0.1:8080"
      ]
    }
  ]
}
Load-balancing enhancement in TCP mode
TCP tunnels will now load-balance traffic between all connected clients that expose the same ports. This is useful for High Availability and when you have multiple locations that serve the same data.
HTTP tunnels already load-balance connections between clients using a round-robbin approach.
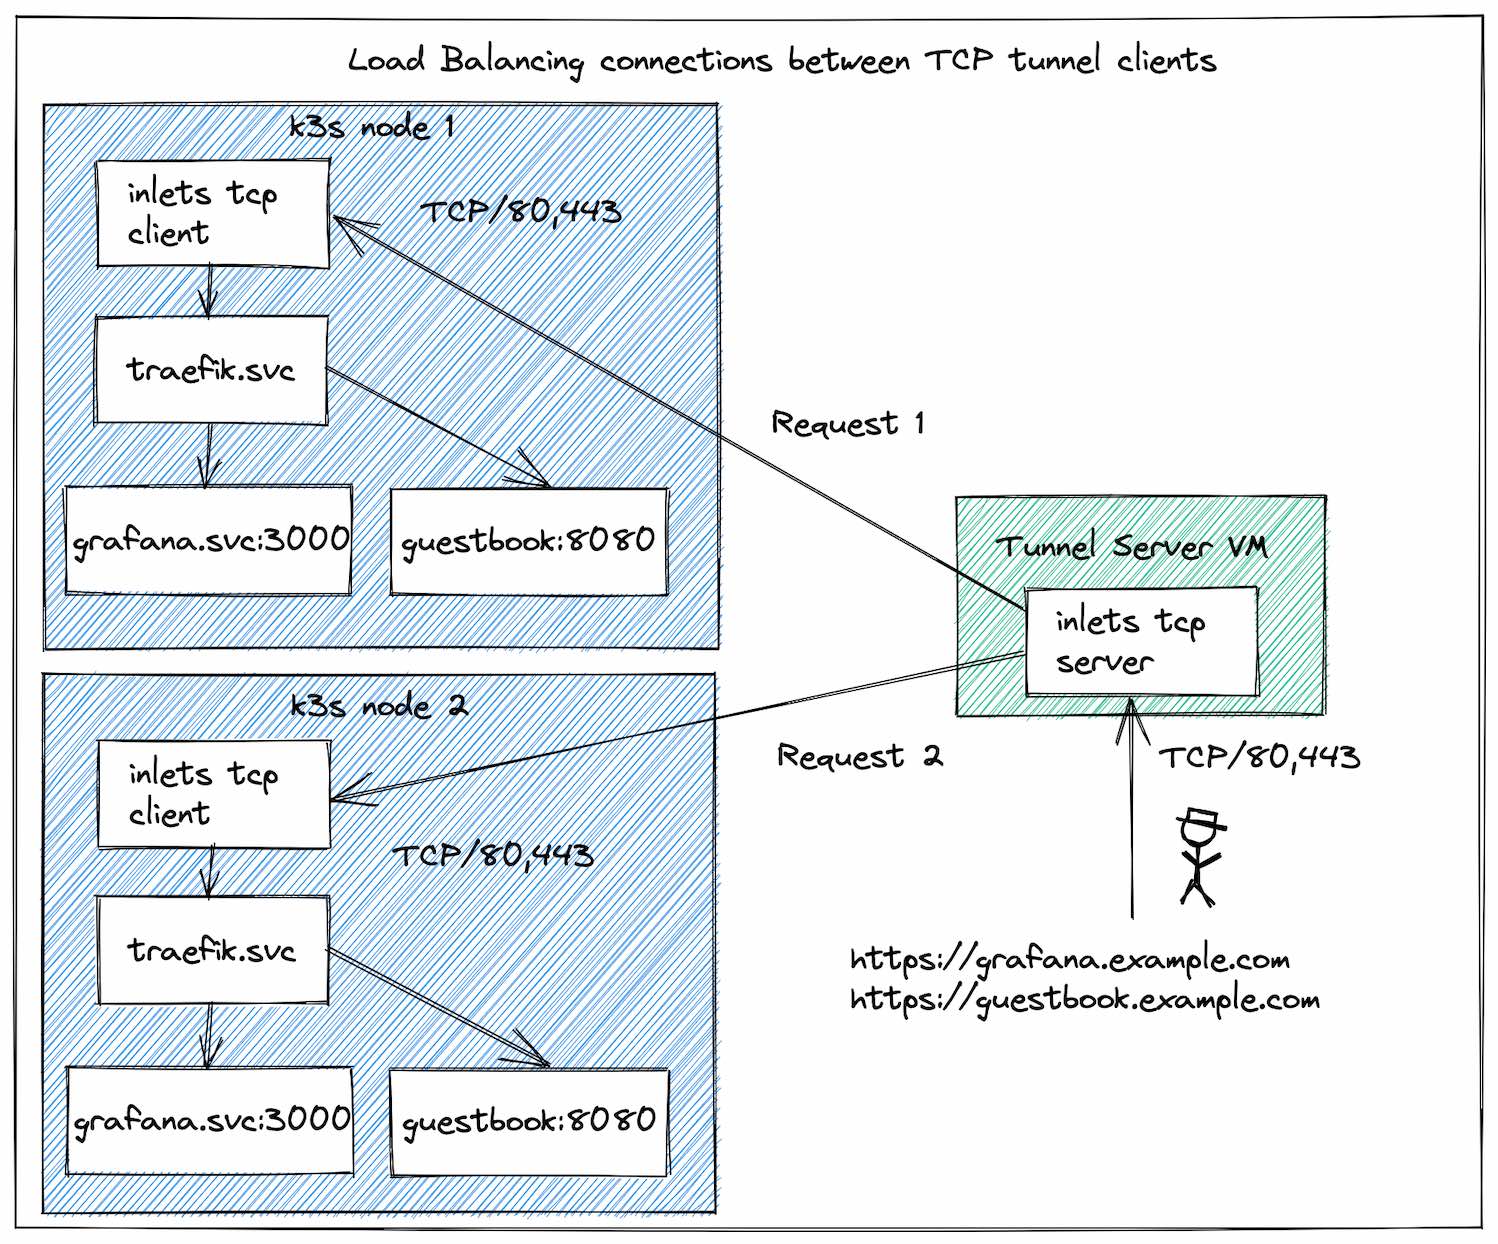
Load Balancing the Traefik Ingress Controller from Kubernetes
Monitoring inlets with Prometheus
In my eBook Everyday Go, I cover patterns and techniques learned from building and contributing to open source Go projects over the past 5 years, one of those patterns is observability of HTTP services.
The easiest way to add Prometheus metrics to inlets was to use the examples from my own eBook.
The moment that you add the built-in Prometheus’ HTTP handler, it automatically makes the count of Goroutines available, the amount of memory used and much more. Then it’s over to you, to decide what you want to measure and monitor them by updating your code and adding various counters, gauges and histograms.
Prometheus has its own query language called PromQL which I’ll use in some of the examples. You can find out more about it here
In the following section I’ll recap the two “planes” of inlets, then I’ll introduce the new metrics and explain each one and give you a sample that you can run in less than 15 minutes to see how it all works with your own tunnels.
The control and data plane
There is a split between the data plane and the control-plane.
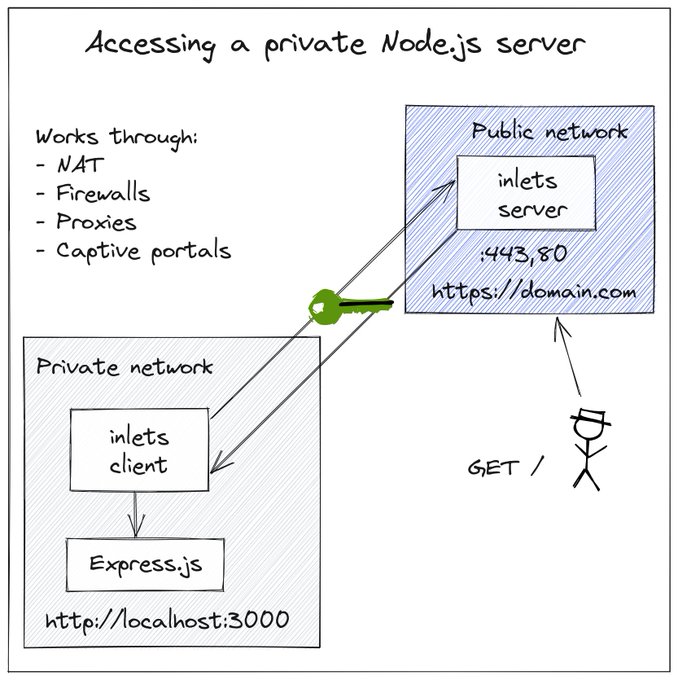
The diagram shows a HTTP tunnel pair and the built-in Let’s Encrypt mode on the server. The control-plane (between the client and server) is on port 8123 and the data-plane is 80 and 443.
- The control plane services the inlets tunnel client over a websocket - usually port 8123 over TLS
- The data plane is either a HTTP port or a number of TCP ports exposed on the exit-server on one of its interfaces for users to access services on the client’s network
From this release going forward, the control-plane provides a connection endpoint for clients, a status endpoint and a monitoring endpoint.
Metrics to answer questions
Here are the questions that customers wanted to ask of the control-plane:
- Are there any clients connected to the server?
- If so, when did they connect? Have any clients attempted which failed authentication?
# HTTP tunnels:
http_controlplane_connected_gauge
http_controlplane_requests_total

# TCP tunnels:
tcp_controlplane_connected_gauge
tcp_controlplane_requests_total
How else could you use the gauge? If running on Kubernetes, it could be used to scale tunnels down to zero replicas, and back up again in a similar way to OpenFaaS. This could be important for very large-scale installations of devices or tenants that have partial connectivity.
For the data-plane, in HTTP mode:
- What are the Rate, Error, Duration (RED) metrics for any HTTP APIs or websites that are being hosted?
http_dataplane_requests_total
http_dataplane_request_duration_seconds
Then for the TCP data-plane:
- How many connections are open at this point in time, and on which ports? i.e. if exposing SSH on port 2222, how many connections are open?
tcp_dataplane_connections_gauge
tcp_dataplane_connections_total
You’ll note that the metrics name depends on which kind of tunnel you run.
On top of the new metrics, you can also monitor the logs of any containers, services or binaries that you run for keywords that key indicate a restart is beneficial, such as “timeout” or “failed”.
Did you know that the inlets client/server has a --generate flag to create a systemd unit file for you? That way you can automate restarts on Linux hosts.
Exploring the metrics
You don’t need to be a Kubernetes user to take advantage of Prometheus for metrics collection and alerting.
You can run it locally on your own machine by downloading the binary here.
Run a tunnel on your local machine:
$ export TOKEN=$(head -c 16 /dev/urandom| shasum | cut -d " " -f 1)
$ echo $TOKEN

# export TOKEN=b43c356ac74946423c93d1b61d16a5d1fc8f8d95

$ inlets-pro http server --token $TOKEN \
  --auto-tls=true \
  --auto-tls-san=localhost \
  --port 8000

$ inlets-pro http client --token $TOKEN \
  --url wss://localhost:8123 \
  --upstream http://127.0.0.1:8080
Then run a simple HTTP server that can expose some metrics:
$ mkdir -p /tmp/share && \
  cd /tmp/share && \
  uname -a > uname.txt

$ inlets-pro http fileserver -w ./ --allow-browsing

Starting inlets Pro fileserver. Version: 0.8.9-18-gf4fc15b - f4fc15b9604efd0b0ca3cc604c19c200ae6a1d7b
2021/08/13 12:24:00 Serving: ./, on 127.0.0.1:8080, browsing: true, auth: false
If you have another service you want to use, feel free to swap it out for the built-in fileserver.
The server is listening to data requests on port 8000 and forwards them all to the client, which then sends them over to the --upstream http://127.0.0.1:8080, of course we would usually run the client and server on different machines, but this allows you to do some basic testing of metrics.
Now create a prometheus.yaml, replace TOKEN with the token from above.
# my global config
global:
  scrape_interval:     15s # Set the scrape interval to every 15 seconds. Default is every 1 minute.
  evaluation_interval: 15s # Evaluate rules every 15 seconds. The default is every 1 minute.
  # scrape_timeout is set to the global default (10s).

# Alertmanager configuration
alerting:
  alertmanagers:
  - static_configs:
    - targets:
      # - alertmanager:9093

# Load rules once and periodically evaluate them according to the global 'evaluation_interval'.
rule_files:
  # - "first_rules.yml"
  # - "second_rules.yml"

# A scrape configuration containing exactly one endpoint to scrape:
# Here it's Prometheus itself.
scrape_configs:
  # The job name is added as a label `job=<job_name>` to any timeseries scraped from this config.
  - job_name: 'prometheus'

    # metrics_path defaults to '/metrics'
    # scheme defaults to 'http'.
    static_configs:
    - targets: ['localhost:9090']
  # The job name is added as a label `job=<job_name>` to any timeseries scraped from this config.
  - job_name: 'http-tunnel'

    # metrics_path defaults to '/metrics'
    # scheme defaults to 'http'.
    static_configs:
    - targets: ['localhost:8123']
    scheme: https

    authorization:
      type: Bearer
      credentials: TOKEN
    tls_config:
      insecure_skip_verify: true
The two scrape targets are for prometheus itself, then the http-tunnel, you can have multiple tunnels within one file each with their own names and Prometheus will scrape them all on the duration you specify.
Then run Prometheus, it will listen on port 9090.
$ prometheus --config.file=./prometheus.yaml

level=info ts=2021-08-13T11:25:31.791Z caller=main.go:428 msg="Starting Prometheus" version="(version=2.29.1, branch=HEAD, revision=dcb07e8eac34b5ea37cd229545000b857f1c1637)"
level=info ts=2021-08-13T11:25:31.931Z caller=main.go:784 msg="Server is ready to receive web requests."
Then make a few HTTP requests to the tunnel server on port 8000:
# The metrics will record a "200"
$ curl http://127.0.0.1:8000/uname.txt
Darwin am1.local 20.2.0 Darwin Kernel Version 20.2.0: Wed Dec  2 20:40:21 PST 2020; root:xnu-7195.60.75~1/RELEASE_ARM64_T8101 arm64

# The metrics will record a "400"
$ curl -i http://127.0.0.1:8000/uptime.txt

HTTP/1.1 404 Not Found
Content-Length: 30
Content-Type: text/plain; charset=utf-8
Date: Fri, 13 Aug 2021 11:26:17 GMT
X-Content-Type-Options: nosniff

unable to find requested file
Now you’ll be able to see the metrics within the Prometheus UI:
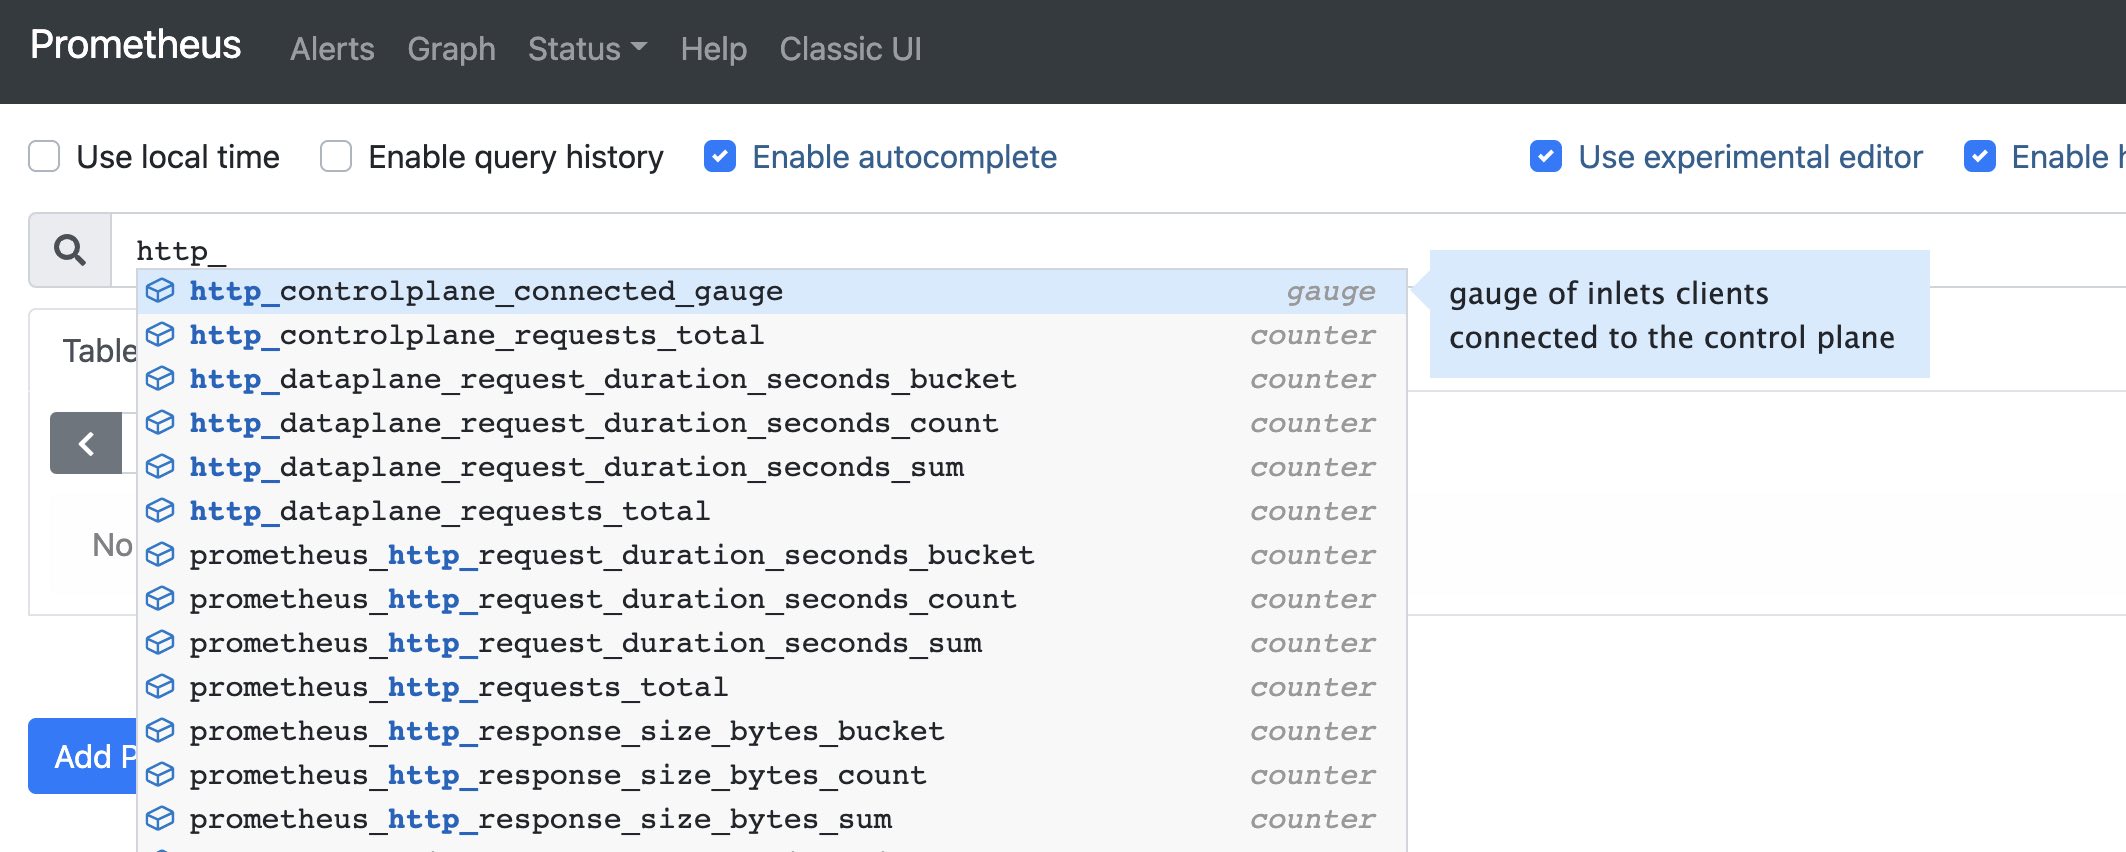
The metrics browser shows you the various names I mentioned above for the HTTP tunnel that we created
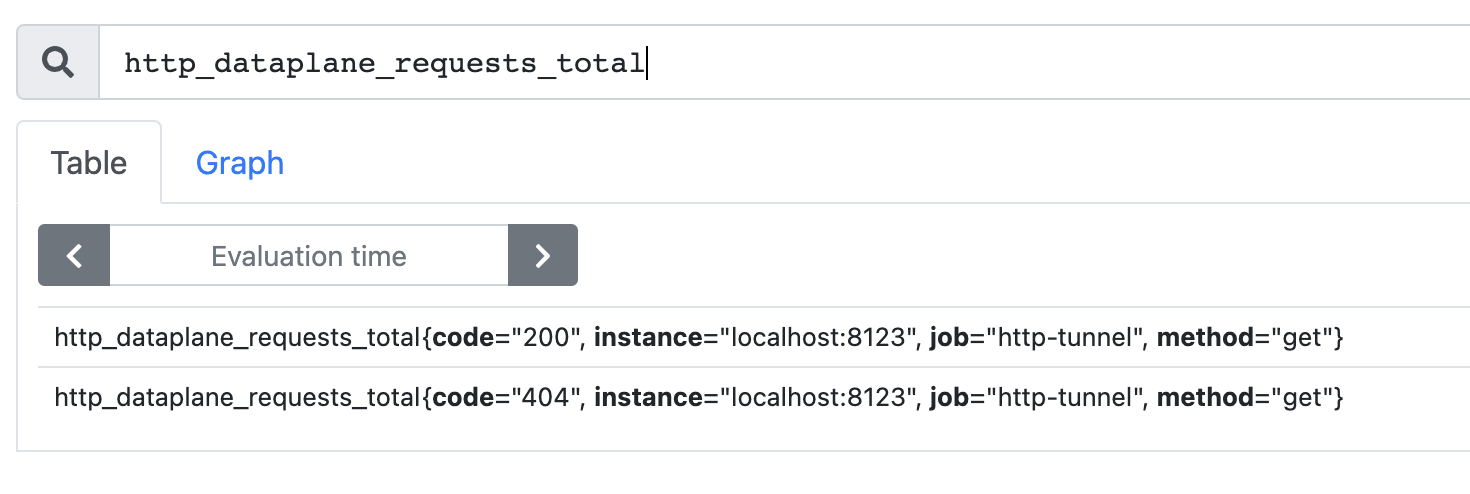
Now enter a specific metrics to view it such as http_dataplane_requests_total which shows the total requests, when they happened and what the HTTP response code was. This is a useful metric for detecting errors in your upstream service.
# All data
http_dataplane_requests_total{}

# Just GETs
http_dataplane_requests_total{method="GET"}

# Just 500s
http_dataplane_requests_total{code="500"}
A more useful metric is usually to sample the data and find the “rate” of a certain HTTP code over a time window:
# 401s over 5 minutes
rate(http_dataplane_requests_total{code="401"}[5m])
What can you do with this data?
- Create a dashboard in a tool like Grafana for pro-active monitoring to understand patterns and problems.
- Define alerts in Prometheus or Grafana to detect problems and take action to fix them.
- Fire alerts into an OpenFaaS function for automatic remediation or escalation.
Wrapping up the release
This has been a big release, so I’d like to thank all of our customers and contributors for their input and help with testing.
As a quick summary, 0.9.0 covers:
- Monitoring and observability support with Prometheus
- A status command and endpoint to help you understand what’s happening with your tunnel servers
- Improved support for PaaS systems through the
--token-envand--license-envflags - Better support for High Availability through the new TCP load-balancing feature
The inlets 0.9.0 client and server are backwards compatible with prior versions, however it is recommended that you upgrade to take advantage of updated dependencies and the newer features listed above.
A release candidate is available today via GitHub releases, and will soon be promoted to the default version for inletsctl and the inlets-operator.
Feel free to reach out to me if you have any questions.
Subscribe for updates and new content from OpenFaaS Ltd.
By providing your email, you agree to receive marketing emails.