How to monitor multi-cloud Kubernetes with Prometheus and Grafana

Johan Siebens
Introduction
There are two main reasons why you may have more than one Kubernetes cluster to monitor. The first use-case is where you own the clusters and have one per stage of development such as development, staging and production. Another is where you run a managed service, or have clients, who run workloads that you need to monitor for reliability, or for consumption as part of a service you run
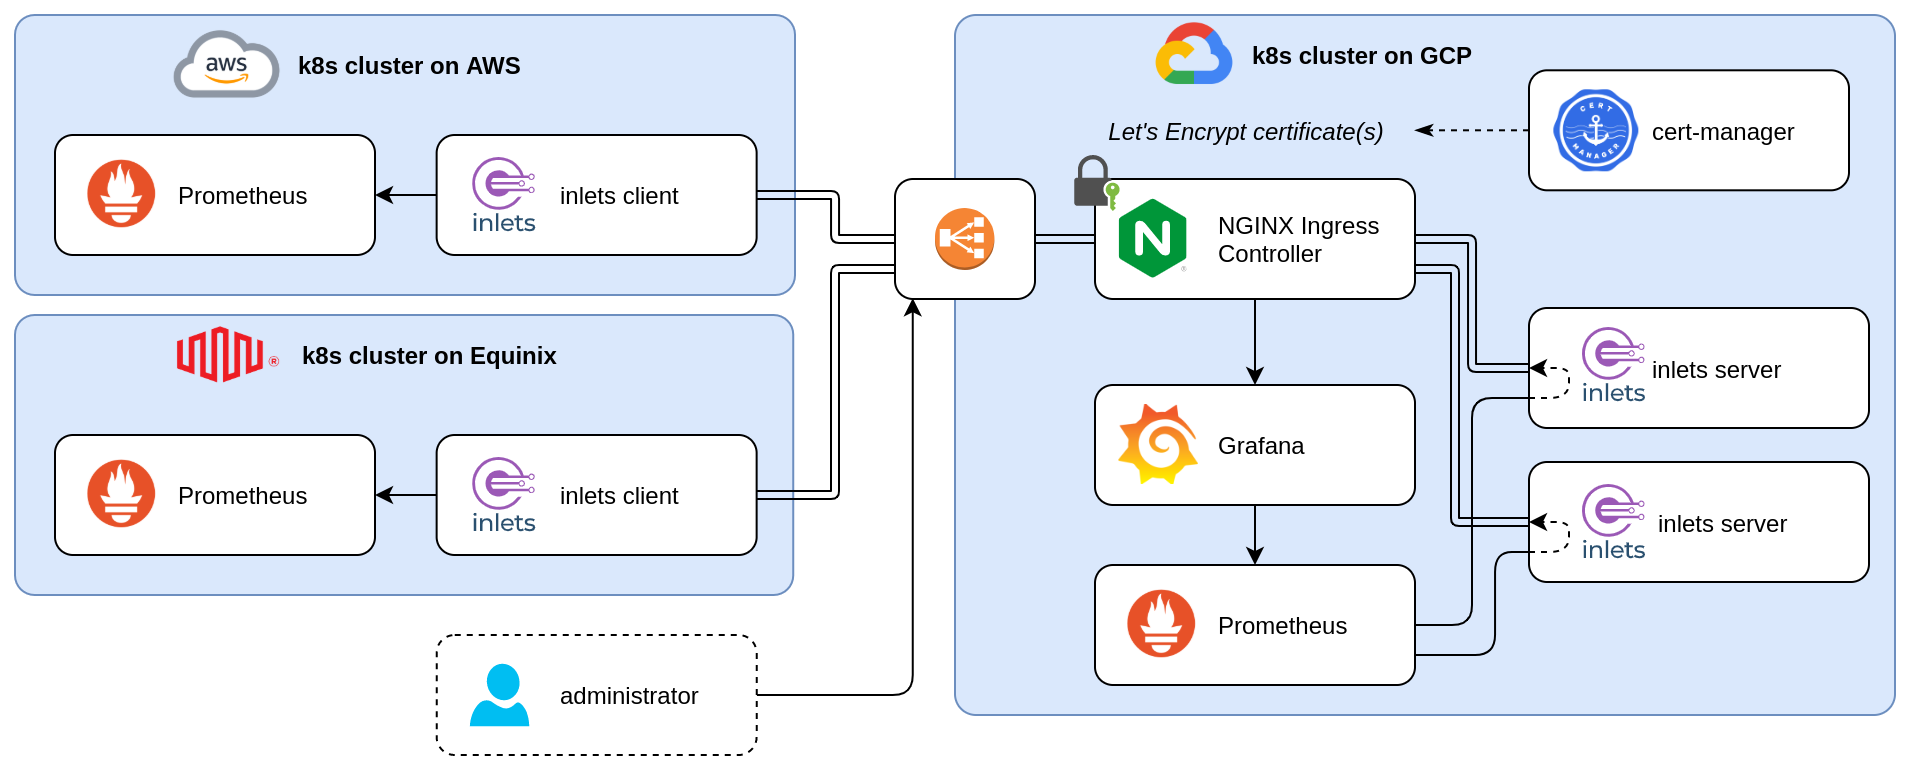
Kubernetes multi-cluster monitoring with Prometheus and inlets
The diagram above shows an architecture where we have multiple “Client” clusters on the left. Prometheus, a widely-adopted open-source metrics-based monitoring and alerting system, is actively monitoring the applications and the clusters. The monitoring set-up in each cluster is very robust and complete; however, there is no clear view on the metrics across clusters.
Using a secure inlets tunnel, those Prometheus servers are reachable from within the cluster on the right, the “Observability cluster. By doing so, the Prometheus server on the left can scrape selected time series from the other Prometheus servers, also know as Prometheus Federation.
For long-term storage, you may also want to consider Thanos or Cortex.
Let’s take a look at how we can build this!
Pre-requisites
- Some Kubernetes clusters running in different locations, e.g. on a public cloud (e.g. GKE, AKS, EKS, DOKS, …) or on a Raspberry Pi in a private home-lab
kubectl, configured to connect to the clusterkubectx, optionally, but useful to manage the different clusterarkade- portable Kubernetes marketplace- A domain and access to your DNS admin panel to create a sub-domain
See the differences between the two versions in the: inlets docs
For this tutorial I’ve prepared three Kubernetes clusters:
- a Kubernetes cluster running on Equinix Metal, orion-equinix
- a Kubernetes cluster running on Amazon Web Services, orion-aws
- a Kubernetes cluster running on Google Cloud Platform, orion-gcp
The first two clusters will act as the “Client” clusters and have a Prometheus server running in the monitoring namespace. Besides Prometheus, some metrics exporters are installed as well, like node-exporter, kube-state-metrics and, one of my favourites, kube-eagle.
The third cluster will be our “Observability” cluster, and likewise to the previous two, Prometheus is also up and running here.
Installing Prometheus and all the components can be done in several ways, but the most common way is to install it using the Prometheus Operator or the official Helm Charts.
$ kubectx
orion-aws
orion-gcp
orion-equinix

$ kubectl get pods,services --context orion-aws -n monitoring
NAME                                                       READY   STATUS    RESTARTS   AGE
pod/node-exporter-dh75f                                    1/1     Running   0          63m
pod/kube-eagle-6687579fd8-xcsns                            1/1     Running   0          63m
pod/prometheus-54d7b46745-lvbvk                            1/1     Running   0          63m
pod/node-exporter-w6xx6                                    1/1     Running   0          63m
pod/node-exporter-p7dbv                                    1/1     Running   0          63m
pod/kube-state-metrics-7476dc6466-74642                    1/1     Running   0          63m

NAME                 TYPE        CLUSTER-IP     EXTERNAL-IP   PORT(S)    AGE
service/prometheus   ClusterIP   10.43.97.123   <none>        9090/TCP   63m


$ kubectl get pods,services --context orion-equinix -n monitoring
NAME                                                     READY   STATUS    RESTARTS   AGE
pod/node-exporter-mzbv2                                  1/1     Running   0          61m
pod/prometheus-67746cf46c-twbjk                          1/1     Running   0          61m
pod/node-exporter-9m4nc                                  1/1     Running   0          61m
pod/kube-eagle-546bd88874-p4wfd                          1/1     Running   0          61m
pod/node-exporter-fjjqv                                  1/1     Running   0          61m
pod/kube-state-metrics-cbfb75b4-kndwz                    1/1     Running   0          61m

NAME                 TYPE        CLUSTER-IP     EXTERNAL-IP   PORT(S)    AGE
service/prometheus   ClusterIP   10.43.148.58   <none>        9090/TCP   61m
Preparing the Observability cluster
First, we have to prepare our Observability cluster.
The goal is the make the Prometheus servers running in the remote “clients” clusters available within this cluster. To achieve this, we will use inlets Pro to create a secure tunnel between the Observability and the Client clusters. The server part of those tunnels, the exit-node, has to be created in the Observability cluster, so that later on, clients can connect and bring Prometheus into this cluster.
Instead of exposing each exit-node pod using a LoadBalancer, we are going to use a IngressController, like nginx, in combination with cert-manager to get some certificates.
First, switch your context to the correct cluster:
$ kubectx orion-gcp
Switched to context "orion-gcp".
Install the nginx ingress controller and cert-manager with `arkade:
arkade install ingress-nginx --namespace ingress-nginx
arkade install cert-manager --namespace cert-manager
Wait a little bit until the nginx load balancer is created, grab it’s public IP address and point your domain to it. Each client will connect to a different subdomain, so the easiest way is to create a wildcard DNS record (e.g. *.prometheus.example.com). If you don’t like wildcard records, create a record for each Prometheus client pointing to the same public IP address (e.g. orion-aws.prometheus.example.com, orion-equinix.prometheus.example.com, …).
Install a certificate Issuer:
apiVersion: cert-manager.io/v1
kind: Issuer
metadata:
  name: letsencrypt-prod
  namespace: monitoring
spec:
  acme:
    server: https://acme-v02.api.letsencrypt.org/directory
    email: <your email>
    privateKeySecretRef:
      name: letsencrypt-prod
    solvers:
    - selector: {}
      http01:
        ingress:
          class: nginx
kubectl apply -f issuer-prod.yaml
Generate a token for your inlets server:
export TOKEN=$(head -c 16 /dev/random | shasum|cut -d" " -f1)
kubectl create secret generic inlets-pro-secret -n monitoring --from-literal token=$TOKEN

# Save a copy for later
echo $TOKEN > token.txt
Create a custom values file with the desired ports for the dataplane. In case of Prometheus, port 9090 is used:
dataPlane:
  type: ClusterIP
  ports:
  - targetPort: 9090
    protocol: TCP
    name: prom-http
    port: 9090
Now get the inlets-pro helm chart and install the chart for each remote Prometheus service.
$ helm repo add inlets-pro https://inlets.github.io/inlets-pro/charts/
$ helm repo update

helm install orion-aws inlets-pro/inlets-tcp-server \
   -n monitoring -f custom.yaml \
   --set ingress.domain=orion-aws.prometheus.example.com

helm install orion-equinix inlets-pro/inlets-tcp-server \
  -n monitoring -f custom.yaml \
  --set ingress.domain=orion-equinix.prometheus.example.com
What is the result of installing this chart:
- a Pod with the inlets Pro server is running
- a Control Plane service of type ClusterIP is created, exposing port 8123
- an Ingress is created with a certificate, making the Control Plane service available in a secure manner
- a Data Plane service of type ClusterIP is created, exposing port 9090
This means that a inlets Pro client can connect to the Control Plane using the proper domain name, e.g. wss://orion-aws.prometheus.example.com/connect, and can punch out port 9090, making it accessible from only within this cluster, because of type ClusterIP.
Connecting the Client clusters
Now that the exit-node pods are running, it is time to connect the clients and so creating a tunnel.
Take all the following steps and execute them against all your client clusters.
Switch your kubectl config to the correct Client cluster:
$ kubectx orion-aws
Switched to context "orion-aws".
Create the secrets for your inlets Pro license and the token:
kubectl create secret generic \
  -n monitoring inlets-license \
  --from-file license=$HOME/inlets-license

kubectl create secret generic \
  -n monitoring inlets-pro-secret \
  --from-file token=./token.txt
And install the inlets-tcp-client chart with the proper values to connect to the exit-node pods in the Observability cluster:
helm install prometheus-tunnel \
  inlets-pro/inlets-tcp-client \
  -n monitoring \
  --set url=wss://orion-aws2.prometheus.sphene.io/connect \
  --set upstream=prometheus \
  --set ports=9090
Monitoring the Client clusters
After installing all the Helm Charts, server and clients, all the Prometheus services are available within our Observability cluster, and now we have some possibilities to visualise all those metrics in Grafana.
Either we add all the different Prometheus servers as separate data sources in Grafana, or we configure the Prometheus server with those endpoints. The second option is for most cases preferable as it allows us the create an aggregated view.
The easiest way to add those targets is via a static config:
scrape_configs:
- job_name: 'federated-clusters'
  scrape_interval: 15s

  honor_labels: true

  params:
    'match[]':
      - '{app="kube-state-metrics"}'
      - '{app="kube-eagle"}'
      - '{app="node-exporter"}'

  metrics_path: '/federate'

  static_configs:
  - targets:
    - 'orion-aws-inlets-pro-data-plane:9090'
    - 'orion-equinix-inlets-pro-data-plane:9090'
With this configuration, the Prometheus on the right of our diagrams mentioned in the beginning of this post, will start scraping the metrics from the other Prometheus server:
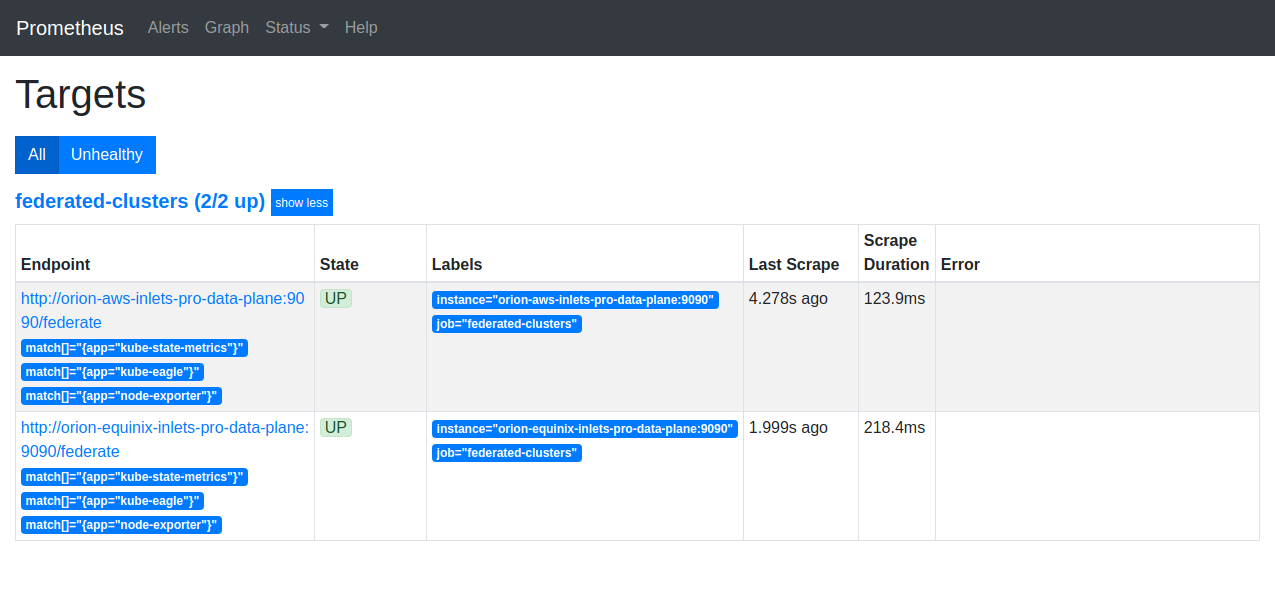
Prometheus scraping the federated client clusters
Now that all metrics are collected in a single Prometheus server, the only thing left to do is building nice dashboards and alerts.
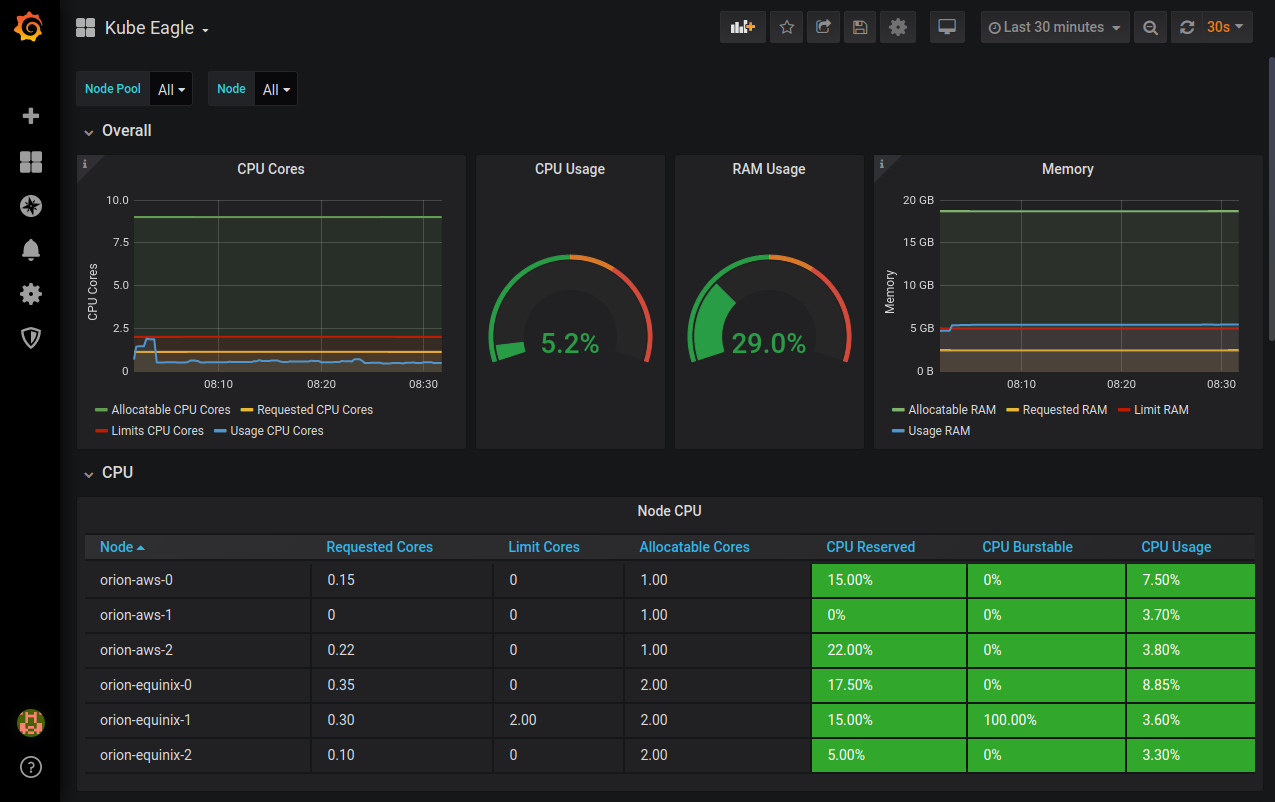
Kube Eagle dashboard giving a multi cluster overview
Wrapping up
This post should give you an idea how easy it is to connect services running in multiple, isolated, Kubernetes clusters spread across cloud providers or running on-premises.
The Helm Charts for both sides of the secure tunnel, server and client, make it very convenient to install the necessary components, and you will have a tunnel in no time.
The Prometheus Federation is an example to illustrate the techniques. However, this kind of set up is applicable in many use cases, like connecting your applications to a database running in a different cluster. Read more here
Further resources:
Subscribe for updates and new content from OpenFaaS Ltd.
By providing your email, you agree to receive marketing emails.