Monitor inlets tunnels with Grafana Cloud
Learn how to monitor your HTTP tunnels for throughput and reliability with inlets and Grafana Cloud.
In a Previous Blog post, Measure and monitor your inlets tunnels, we showed how inlets HTTP and TCP tunnels can be monitored with Prometheus. There are two reasons to monitor your tunnels - for reliability of the tunnel itself and for throughput of any services that you’re exposing through the tunnels.
In this tutorial we will see how you can set up the Grafana Agent on your inlets server to collect metrics and monitor them with Grafana Cloud.
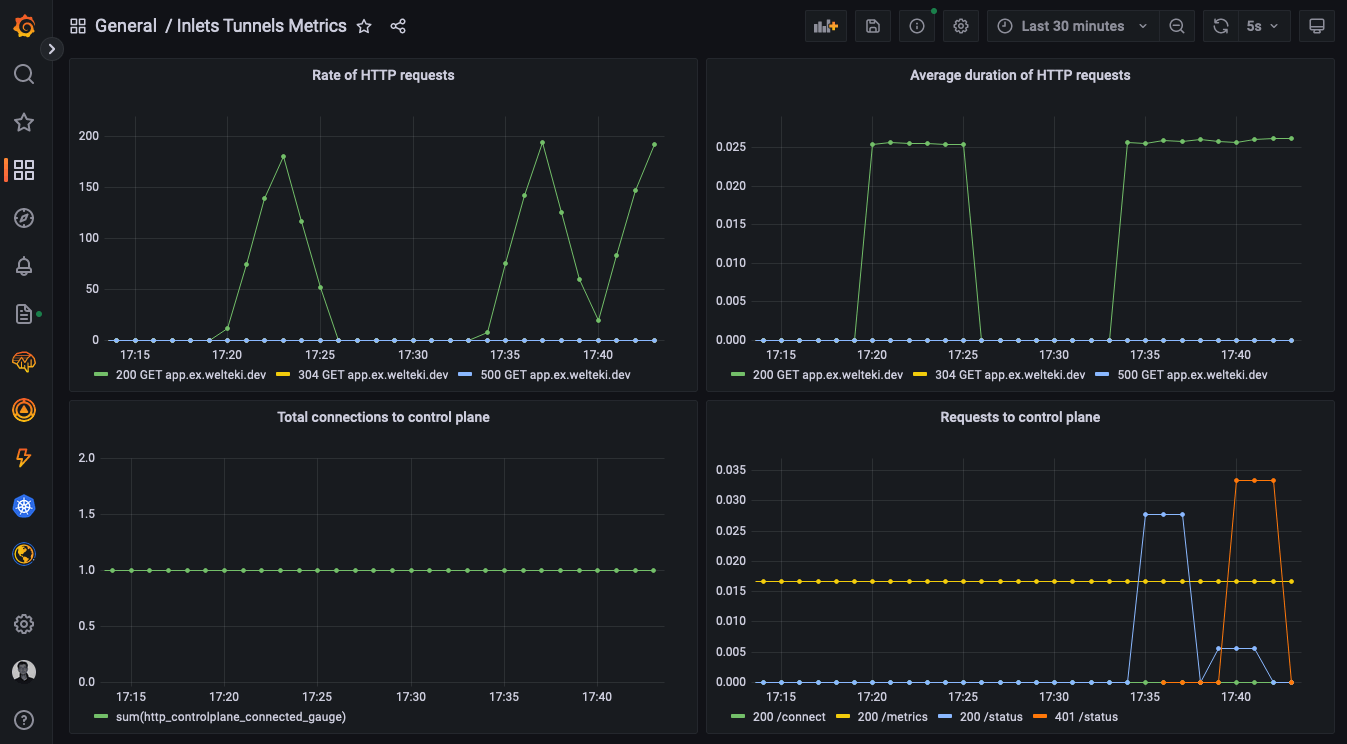
A Grafana dashboard for monitoring inlets.
Grafana Cloud means that we can quickly setup a complete monitoring stack for our tunnels without having to worry about finding somewhere to run and maintain Prometheus and Grafana.
As an example we will create a tunnel server to expose a Node.js microservice running locally. We will setup the Grafana Agent on the inlets server and configure it to push the inlets metrics to Grafana Cloud.
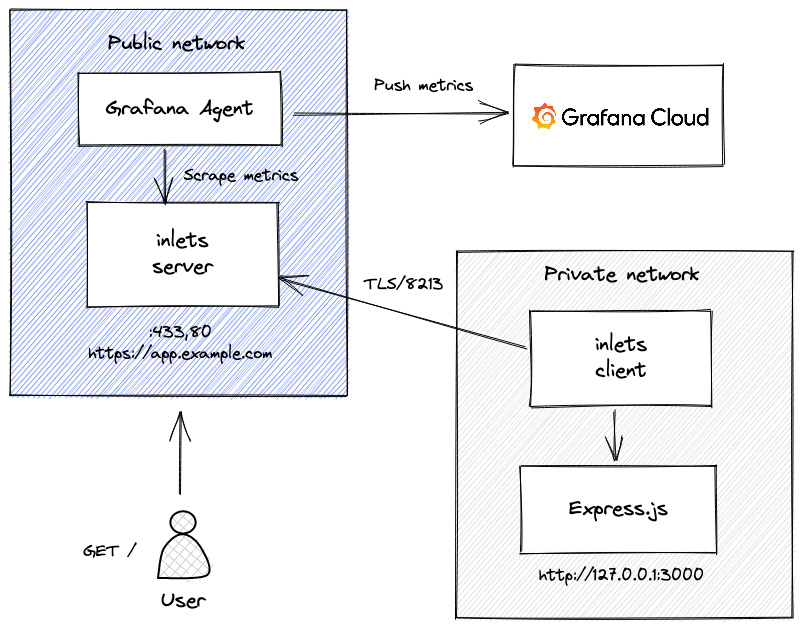
Conceptual diagram: Grafana Agent running on inlets tunnel server and pushing metrics to Grafana Cloud
Create a tunnel server
Setting up a tunnel server is very straightforward with the inletsctl tool. It has support for deploying to around a dozen cloud providers.
For this tutorial we will deploy a tunnel server on DigitalOcean
inletsctl create \
    --region fra1 \
    --provider digitalocean \
    --access-token-file ~/.do/access-token \
    --letsencrypt-domain app.example.com
This command will create a VM in your DigitalOcean account. Once the tunnel server has been created it will print out: the ip address, the inlets token and the endpoint for inlets client to connect to.
Take note of these as we will need them later on.
Make sure to create a DNS “A” record for the IP address of the tunnel server on your domain control panel.
Connect the tunnel client
Once the inlets server is up and running we can set up a client and use it to access an app running in our local network. In the example we are going to expose a simple Node.js microservice .
Clone the repository and run the microservice:
git clone https://github.com/alexellis/expressjs-k8s.git
cd expressjs-k8s

npm install

http_port=3000 node index.js
The microservice should now be accessible locally via http://127.0.0.1:3000.
The README for the example also has instructions to run it with docker if you prefer that.
Start the tunnel client to make the microservice accessible from your public URL:
export URL=""
export TOKEN=""

inlets-pro http client \
  --url $URL \
  --token $TOKEN \
  --upstream app.example.com=http://127.0.0.1:30000
Did you know? You can even serve multiple HTTP services and domains over the same HTTP tunnel. You can find out how here: Serve traffic through a private tunnel
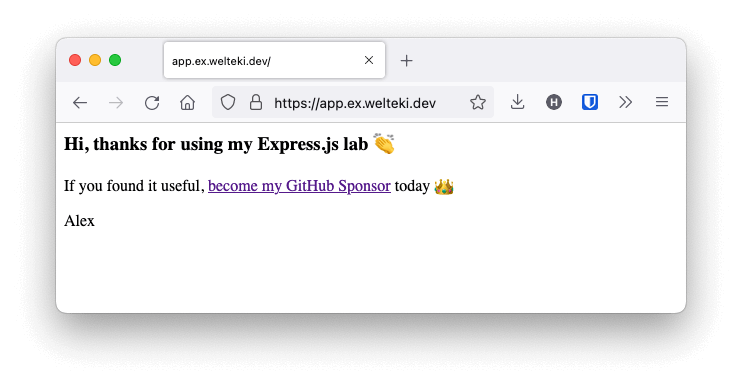
Verify that you are able to access the app at the domain you have configured.
Collect metrics with the Grafana agent
The Grafana Agent will be used to collect observability data and send it to Grafana Cloud. The agent needs to be deployed to our tunnel server and configured to collect the Prometheus metrics from the monitoring endpoint.
You will need to SSH into the tunnel server to set up the Grafana Agent. Instructions for retrieving the root password and accessing your server might be different depending on the provider you chose. If you deployed to DigitalOcean you should have received an email with the root password for your server. Use it to log in to your server over SSH.
Once logged in you need to fetch the latest version of the agent.
curl -O -L "https://github.com/grafana/agent/releases/latest/download/agent-linux-amd64.zip";
unzip "agent-linux-amd64.zip";
chmod a+x agent-linux-amd64;
Create a configuration file so it knows which endpoints it has to scrape and where it has to send this data.
export GRAFANA_CLOUD_USERNAME=""
export GRAFANA_CLOUD_PASS=""
export TUNNEL_TOKEN=""

cat << EOF > ./agent-config.yaml
metrics:
  global:
    scrape_interval: 60s
  configs:
  - name: hosted-prometheus
    scrape_configs:
      - job_name: node
        static_configs:
        - targets: ['localhost:9100']
      - job_name: inlets
        static_configs:
        - targets: ['127.0.0.1:8123']
        scheme: https
        authorization:
          type: Bearer
          credentials: $TUNNEL_TOKEN
        tls_config:
          insecure_skip_verify: true
    remote_write:
      - url: https://prometheus-prod-01-eu-west-0.grafana.net/api/prom/push
        basic_auth:
          username: $GRAFANA_CLOUD_USERNAME
          password: $GRAFANA_CLOUD_PASS
EOF
Than start the agent with this command:
./agent-linux-amd64 --config.file=agent-config.yaml
For more information on the agent, take a look at the Grafana docs. The documentation also has instruction to create a systemd service for the agent.
Now that the agent is running we can use Grafana Cloud to explore the metrics.
Explore the metrics in Grafana Cloud
In the menu bar of the dashboard UI there is an explore icon. Explore strips away the dashboard and panel options and is intended to help you build and explore your queries. You can use it to start building the queries for your inlets dashboard.
The inlets server exports metrics for both the controle-plane and the data-plane. The metrics names are prefixed differently depending on whether you are running your server in HTTP or TCP mode.
The inlets docs contain a complete overview of all the available metrics
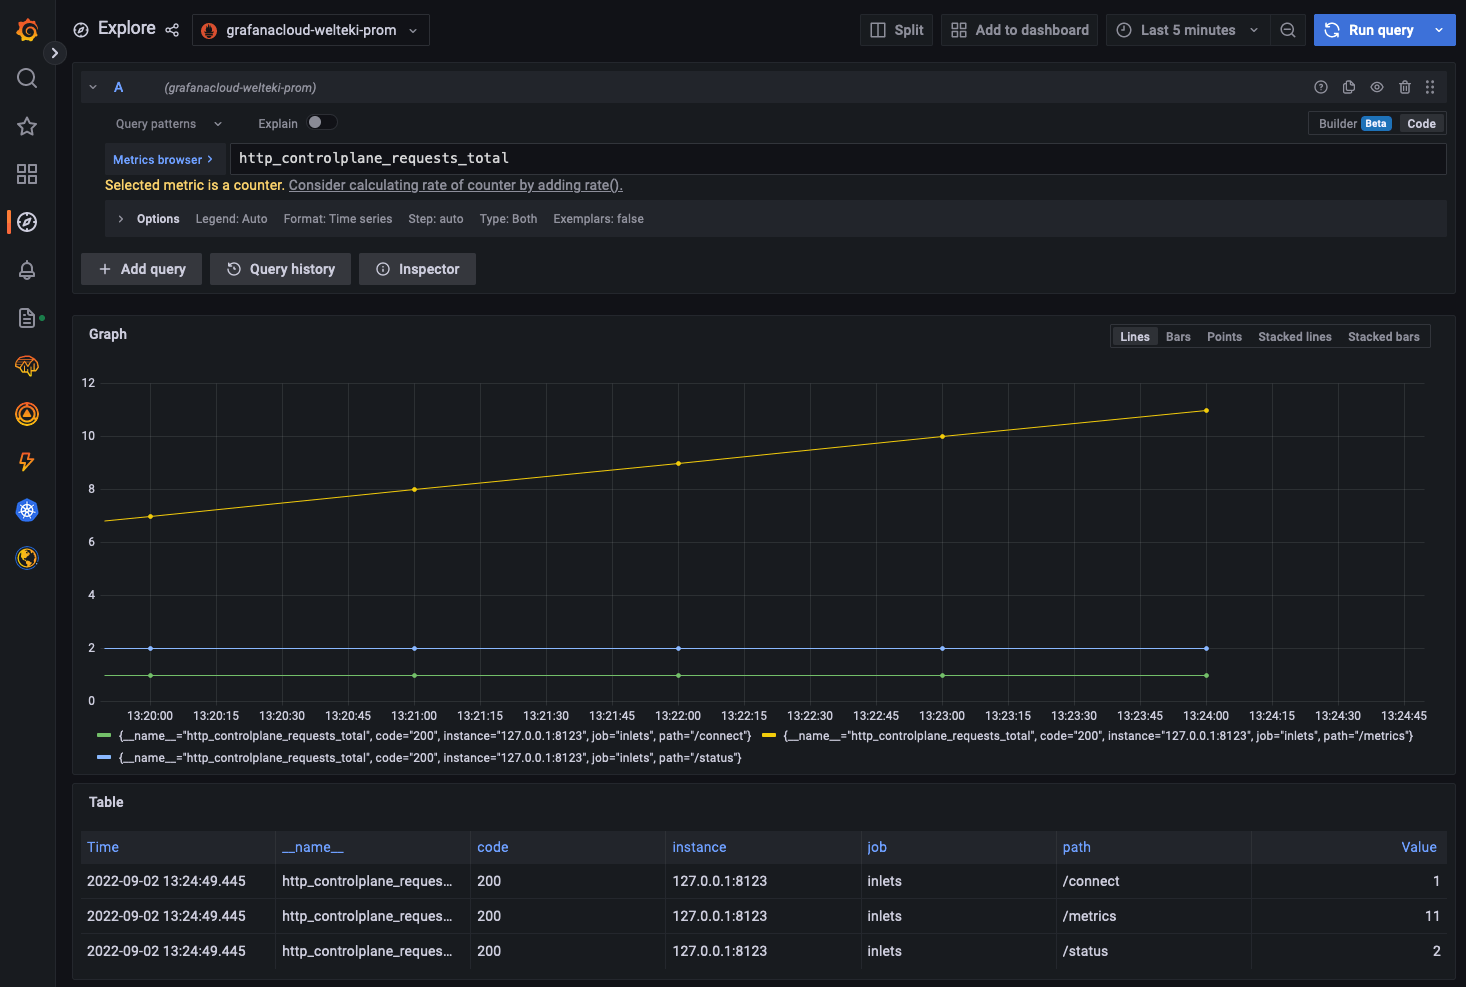
The total amount of requests made to the control-plane of a HTTP tunnel.
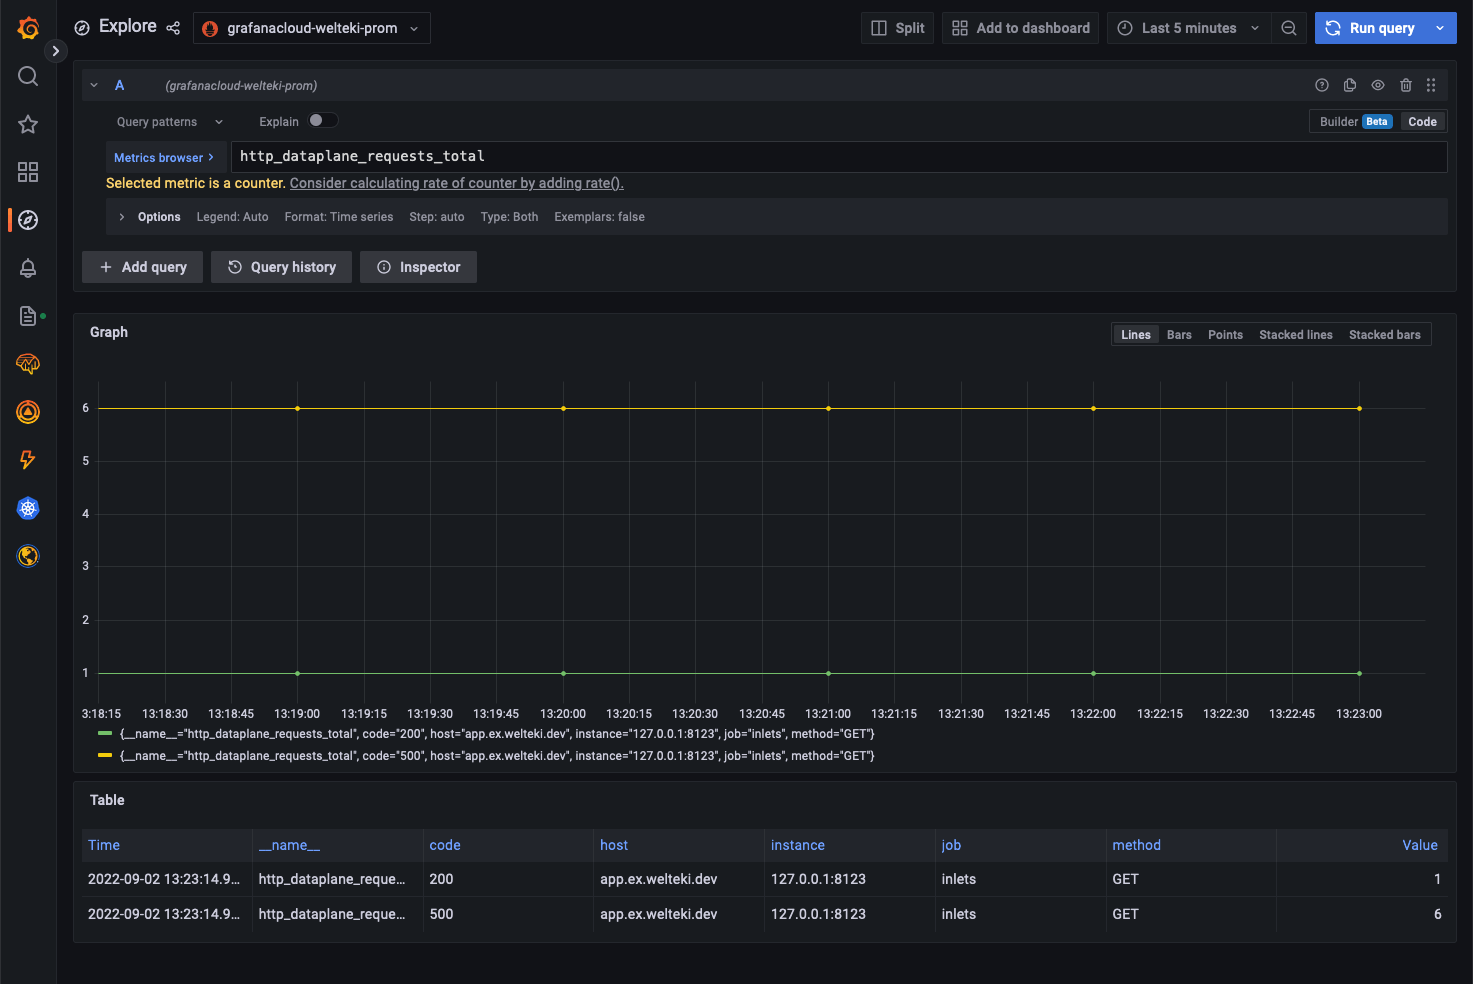
Counter for the request made to the data-plane of a HTTP tunnel.
Create a Grafana dashboard
Now that you have an overview of metrics that are available for inlets and explored some queries we can start to create a dashboard.
The metrics that are available from the tunnel server allow you to get insight in the three key metrics you should probably measure for every service in your architecture:
- Rate - the number of requests your service is serving.
- Error - the number of failed requests.
- Duration - distributions of the amount of time each request takes.
To display these metrics in grafana we will add two panels to the dashboard. We can get the rate of requests for each status code and HTTP method with this query:
rate(http_dataplane_requests_total[$__rate_interval])
Note that we are using the variable
$__rate_intervalfor the range. Selecting a good range can be difficult. This variable makes it easier. You can checkout this post on the grafana blog for more details.
To get an insight in the average duration of HTTP requests we use this query:
rate(http_dataplane_request_duration_seconds_sum[$__rate_interval]) /
rate(http_dataplane_request_duration_seconds_count[$__rate_interval])
The request rate can also be measured for the control-plane. This could for example help you detect if there are clients that are trying to connect but fail authentication.
rate(http_controlplane_requests_total[$__rate_interval])
You can get the JSON model for the complete dashboard from this GitHub Gist.
A tool like hey can be used to generate some load on the app. You can check the dashboard to verify that this shows up.
A convenient way to get
heyand many other CLI’s is with arkade. Simply runarkade get hey.
hey -c 10 -q 20 -z 3m "https://app.example.com"
This runs 10 workers concurrently, each making 20 queries per second over a time period of 3 minutes.

The Grafana dashboard showing the load that was generated with hey. Since a HTTP tunnel can be used for multiple domains, we’ve also included the Host: in the two dataplane metrics. This will be useful for you if you wanted to expose say the node application and something else under different domains.
Conclusion
Grafana Cloud allows you to quickly setup monitoring for your inlets tunnels. The Grafana Agent lets us collect metrics from the tunnel server and pushes them to the cloud. We don’t need to worry about running a Prometheus instance ourselves and making sure the metrics data is persisted safely.
By using an inlets HTTP tunnel, we were able to gather metrics for our Node.js microservice without making any changes to it. That makes getting Rate, Error, Duration (RED) metrics for your services really simple. Just tunnel them through inlets.
You can tunnel multiple different domains or private services through the same tunnel server. Each of them will show up with a different “Host” value in the legend for the metrics. If you connect multiple inlets clients with the same domain specified in the –upstream flag then inlets with load balance between them.
If you have any questions, feel free to reach out.
Subscribe for updates and new content from OpenFaaS Ltd.
By providing your email, you agree to receive marketing emails.